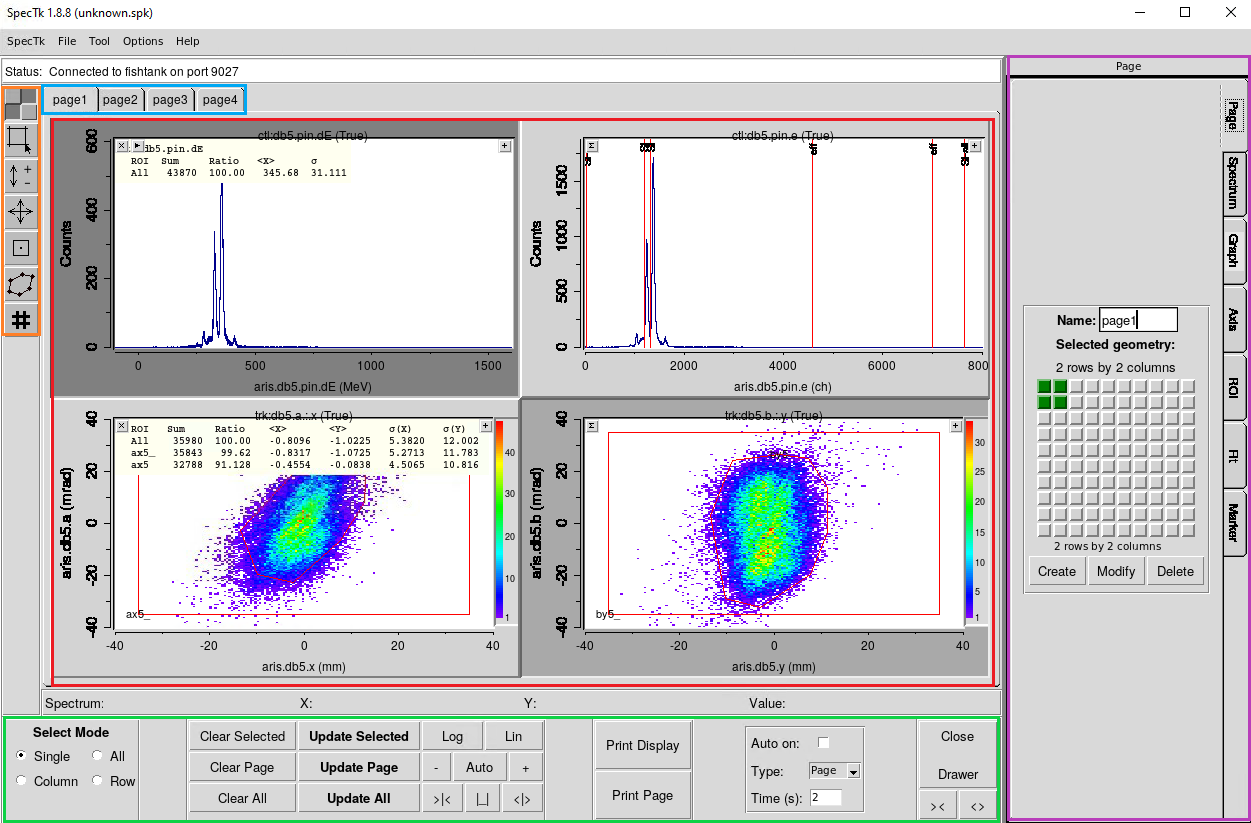
Red – Main Display Area: This is where your spectra are shown. You can have multiple plots displayed, including 1D and 2D histograms. Each plot can show ROIs, gates, and statistical overlays. Selected plots appear darker and can be selected using Shift-click or with the Select tool (in the green section).
Blue – Page Tabs: This lets you organize spectra across multiple pages, each containing a customizable grid layout (up to 10x10). You can rename pages (using the Drawer tool in the Purple section) and reorder them using the Tool menu for better organization.
Orange – Left Toolbar: This vertical toolbar gives you quick access to interaction tools:
Green – Top Controls: These provide quick access to selection modes, spectrum refresh, axis controls, printing, auto-update toggling, and drawer visibility. From left to right, the buttons allow you to:
Purple – Right Drawer: This is one of the most powerful parts of SpecTk. It includes multiple tabs:
The Superimpose tool (found under the “Spectrum” drawer) allows you to overlay multiple spectra within a single plot for visual comparison.
SpecTk includes the ability to fit to three 2D models: