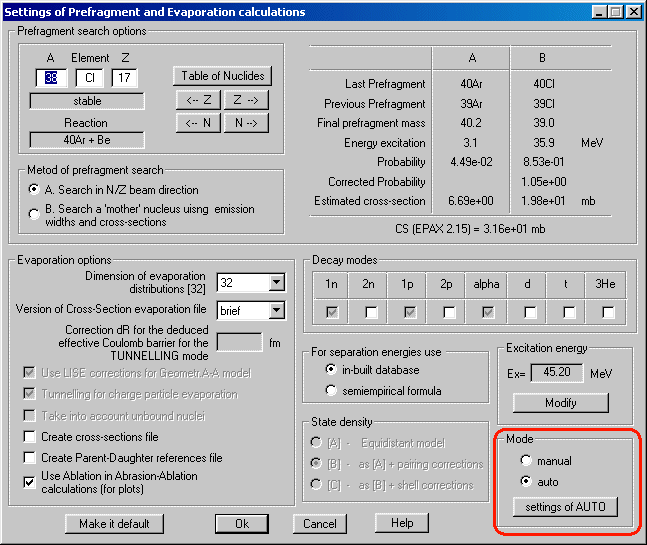
Fig.1. The dialog “Settings of Prefragment and Evaporation calculations”.
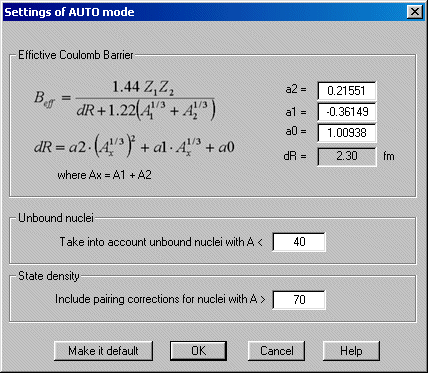
Fig.2. The new dialog “Setting of AUTO mode for evaporation options”.
|
|
| lise.nscl.msu.edu
http:"//lise.nscl.msu.edu |
Dubna
- East Lansing
19-Sep-2001 |
LISE & Excel
LISE & Internet
Contents:
1.1. Auto mode for the abrasion-ablation model2. LISE & Excel - version 5.7
1.2. On-line LISE-analysis of experimental plots
1.3. Calculation of the wedge thickness
3. LISE & Internet - version 5.6
1.1 Auto mode for the abrasion-ablation model
As it was shown in version 5.4 there are various recommended
meanings of Abrasion-Ablation model options depending on the prefragment
mass. However it is inconvenient to enter values
each time when changing the projectile-target combination. In this
connection, in the new version the opportunity of automatic input of options
was entered depending on the prefragment mass. An opportunity of manual
input options is kept, too. The dialog “Settings of prefragment” is shown
in Fig.1, where the choice of auto or manual modes is outlined by a red
rectangle. The tunneling, choice of state density, unbound nuclei and geometrical
corrections blocks are not accessible in the case of the automatic mode.
The program automatically puts values defined by the user in the dialog
“Settings of AUTO mode” (see Fig.2).
The parameter dR has been fitted by a parabolic
dependence on the value (A pf)1/3, so for
mass A=200 the value dR is equal to 6 fm, for mass
A=2 accordingly it is equal to 0 fm (two points A=40 and 58 have been used
also, see the documentation of version 5.4).
Further the improvement of automatic adjustments for
excitation energy and state density is supposed.

Fig.1. The dialog “Settings of Prefragment and Evaporation calculations”.

Fig.2. The new dialog “Setting of AUTO mode for evaporation options”.
1.2. On-line LISE analysis of experimental plots
Into the concept of the program LISE development enters not only input of new tools (new models of reaction mechanisms, etc.) able to help physicists in the prediction of products' outputs, but also further development of the mechanism of experimental data analysis. In the new version the apparatus for work with experimental spectra obtained by the program BI was developed. The analysis of experimental two-dimensional peaks can be divided into 4 stages:
The first stage is reading an experimental
spectrum by the program BI. An example of such a spectrum is shown in Fig.4-1.
This spectrum is obtained with the spectrometer A1900 (NSCL MSU) in the
reaction 18O (120AMeV) + Be (this experiment is discussed in
more detail in the chapter “Version 5.5”).
The second stage is the determination of the program-BI parameters for the analysis of the initial spectrum, and the analysis itself. The program creates a text file with the found peaks and an output spectrum with the found peaks in the format of the initial spectrum (Fig.4-2).
The third stage is the new stage,
which helps the user to avoid unnecessary peaks and also to initialize
“good” peaks. After search of peaks by clicking on the button “Plot” in
the dialog “BI” the user gets an output spectrum (Fig.4-3), where the determined
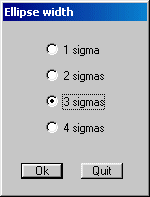
peaks are shown by ellipses with serial numbers. The semi-axes of ellipses
by default are equal to three standard deviations (s ) found by the program
BI. However, the user can redefine their size pressing the icon ![]() (see Fig.3). The double clicking of the right button of the mouse on a
peak allows editing this peak. The user can switch off the peak using the
checkbox “Available” and/or give a name (see Fig.5). The new spectrum obtained
after selection from the previous spectrum (Fig.4-3) is shown in Fig.4-4.
(see Fig.3). The double clicking of the right button of the mouse on a
peak allows editing this peak. The user can switch off the peak using the
checkbox “Available” and/or give a name (see Fig.5). The new spectrum obtained
after selection from the previous spectrum (Fig.4-3) is shown in Fig.4-4.
The fourth stage is recording selected
peaks on a disk (clicking the icon ![]() )
and reading them by another program (for example MS Excel).
)
and reading them by another program (for example MS Excel).
Within 10 minutes the user gets the table with found selected peaks with the characteristics (average values, standard deviations, area) that can be used for the further analysis (cross sections, momentum distributions, calibrations, etc.).

Fig.5. The dialog of editing peak characteristics.
1.3. Calculation of the Wedge thickness
The opportunity of calculation of a material thickness appropriate for an initial kinetic energy and an energy after this material was specially entered in the Physical Calculator earlier. However, as experience has shown, some users have difficulties when calculating the wedge thickness for known input and output energies. In this connection, the opportunity to calculate the wedge thickness for the defined fragment proceeding from the values of the magnetic rigidities Br 1 and Br 2 has been created in the dialog “Degrader in Dispersive Focal Plane”.
To calculate the wedge thickness it is necessary beforehand to input the values of the magnetic rigidities (items 1 and 2 in Fig.6) and to press afterwards on the key “Calculate thickness” in the dialog “Degrader in Dispersive Focal Plane” (item 3 in Fig.6).
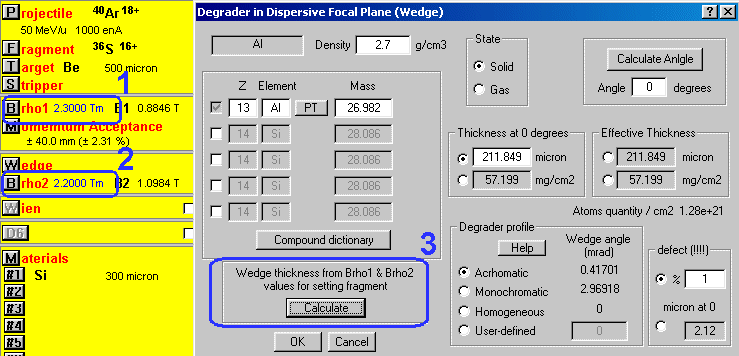
Fig.6. Calculation of the wedge thickness for the defined fragment from the magnetic rigidities Brho1 and Brho2.
2. LISE & Excel - version 5.7
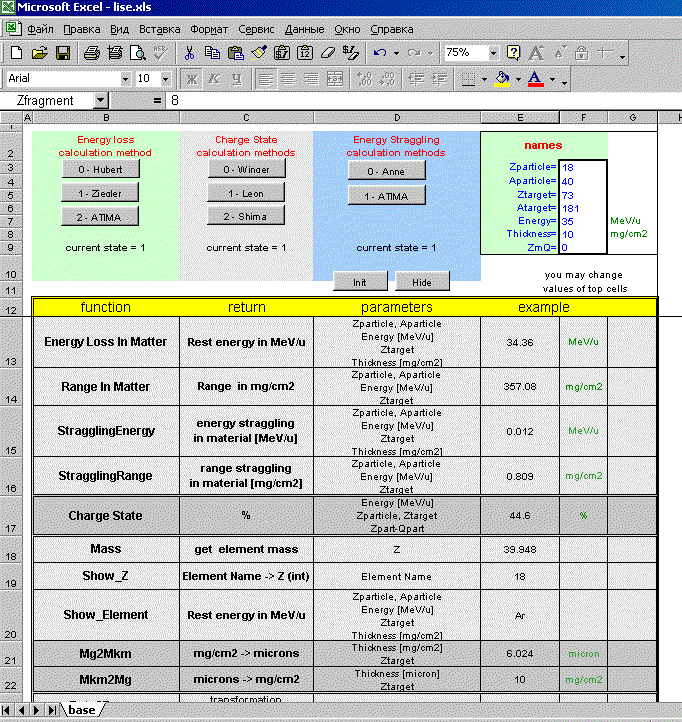
Fig7. The file “LISE.xls”.
The opportunity of using the LISE huge computing luggage by other programs has appeared in the new version of the LISE code. Some subroutines were replaced from the module LISE.EXE in separate libraries (*.DLL), and can be executed from these libraries by other programs. The modules of calculation of energy losses in matter, range in materials, stragglings of range and energy losses, and also empirical parameterization of cross sections (EPAX 2.15) can now be used for calculations in sheets of MS Excel. It is necessary to notice, that such opportunity exists only for the versions of the program LISE installed in a standard way, instead of taken from the “open version” directory. New libraries will be placed by the install program in the directory windows/system (OS Windows 98/Me) or windows/system32 (OS Windows NT/2000) in the case of a standard way installation. In the program LISE package there is the file LISE.XLS (version MS Excel 8 or higher), which is placed in the root LISE directory and for which the icon from the starting menu of the program LISE is created. This file contains connections (via Visual Basic) with libraries of the program LISE (see Fig.7). Also this file contains one sheet with examples of all functions available in these libraries. At loading the given file the window will appear with a question: to include/avoid macro-functions, on what you should include macros, if you want to use the LISE luggage.
If you want to use functions of the program LISE in other Excel files, the file LISE.XLS should be loaded previously. Then the user should execute the Excel command “Insert function” (shift F3), and choose a function necessary for you from the list of functions determined by the user (for example “lise.xls!EnergyLossInMatter”).
With use of these libraries the user can create sheets
with various amount of detectors (reminder: in the program the maximum
quantity of detectors is equal to 7), to use the tables for calibrations,
etc., using thus all the power of Excel. An example of such a file is found
at the address:
http://http:"//lise.nscl.msu.edu/5_8/lise_example.xls.
Only do not forget to earlier load the file LISE.XLS.
3. LISE & Internet - version 5.6
The program has received in the new version an access to databases through the Internet (databases of Isomers and TOI), and also utilities of automatic informing of the new version of the program and connection with sites of the LISE program.
3.1. Access to databases
The LISE program has the built-in database (Audi & Wapstra 95) of nuclide characteristics (separation energies, half-lives etc.). However the user frequently requires more extensive information during the preparation of experiment and its realization. Supplement of the program LISE by other databases can essentially change the size of the program. Thus as the majority of users of the program have access to the Internet, it was decided to approach the appropriate databases directly by the program.
3.1.1. Isomer database
Nuclei having isomeric states are marked on the table of nuclides in the program by green rectangle in the left bottom corner (see Fig.8, item A). The information about isomeric states is taken from the database located on the site of the LISE spectrometer (www.ganil.fr/LISE). This database has been created by Dr.Jean-Michel Daugas. The user gets a window of statistics clicking by the right key of the mouse on the isotope rectangle on the table of the nuclides. If the isotope has an isomeric state, in this window the button “Isomer” (see Fig.8, item B) will appear. Pressing this button, the information from the GANIL site will be loaded into default browser (Fig.9). The information about isomers is accessible for isotopes with mass less than 84.

Fig.8. The window of transmission characteristics of 38Cl.
3.1.2. TOI
Pressing on the button “WWW TOI” (see Fig.8, item C) in the statistics window, the user will get the information on the given isotope from the database TOI located on the site in Sweden (see Fig.10).
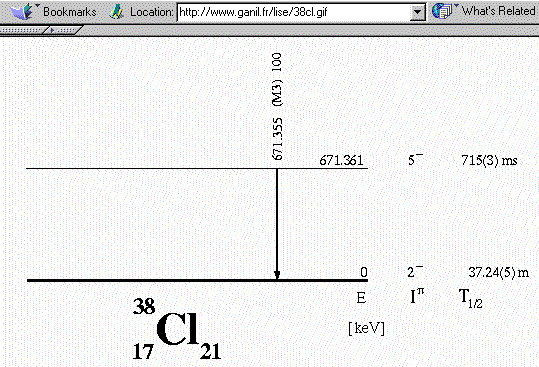
Fig.9. Scheme of 38Cl isomeric decay from the LISE site (France).
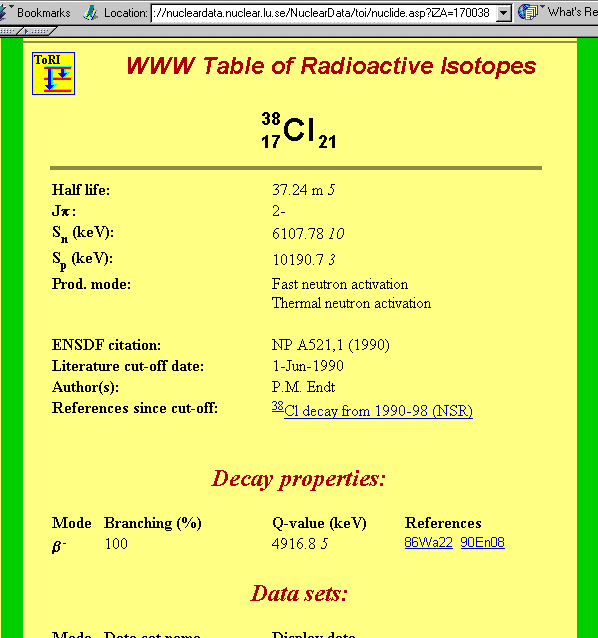
Fig.10. Information about the isotope 38Cl from the TOI database located in Sweden.
3.2. Check to the new version
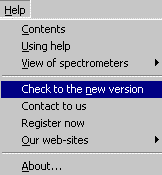
An access to the Internet utilities of the program LISE is realized through the menu “Help” (see Fig.11). The user can in the dialog “Check to the new version of the code” (Fig.12):
Unfortunately one issue has not been yet solved - at which the program undergoes a crash. It is connected with the absence of access to the Internet when the code checks the new version. The Internet access block was realized with the compiler Builder 5.0, whereas the program is compiled by Borland 5.02 OWL. But in any case the program will replace the date of check and at the subsequent start the program will be loaded without automatic check to the new version.
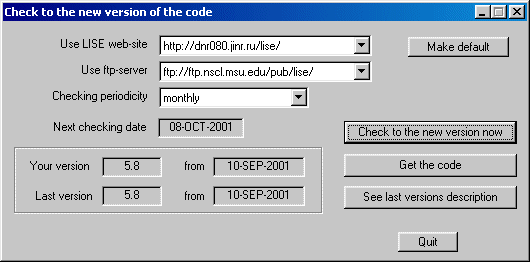
Fig.12. The dialog “Check to the new version of the code”.
3.3. Mail and registration from the code
From the menu “Help” the user may (see Fig.11)
4.1. Brho Scanning Plot
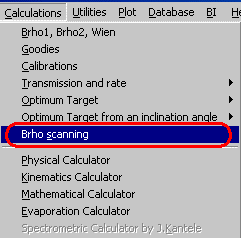
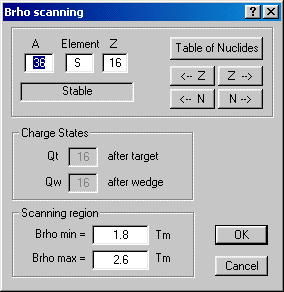
A new utility to help the experimenter in the analysis of the experimental information was developed in the new version. Frequently in experiments there is a necessity of scanning of reaction-products outputs depending on magnetic rigidity. The given procedure will be carried out for study of momentum distribution and production cross sections, and also for obtaining spectrometer settings for an optimum output of the fragment of interest (maximal output, best relation of setting fragment to background, etc.). Also the scanning represents the large interest from the point of view of comparison of the calculations done within the LISE program with the experimental data, which in turn allows modifying the parameters of models in the program for the best agreement with experiment.
 |
 |
|
new utility “Brho Scanning” |
|
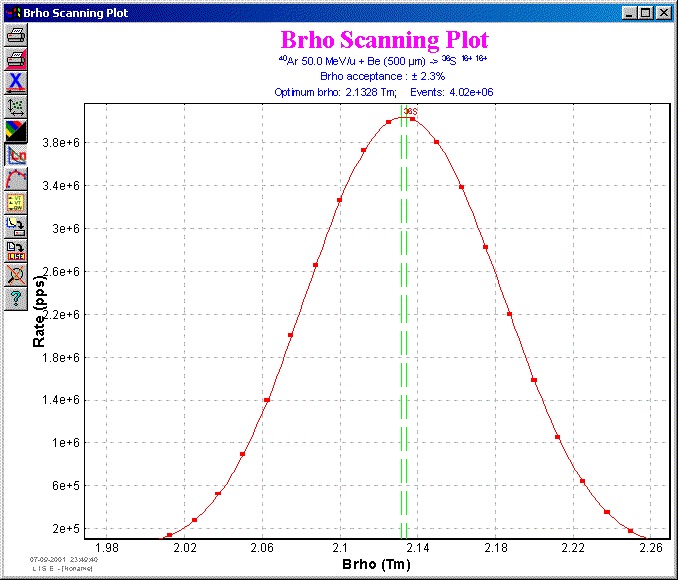
Fig.15. The Brho scanning plot for the selected fragment 36S.
4.1.1. Comparison of calculations with experimental data
New possibilities of the code: Brho scanning and On-line LISE analysis of experimental plots (version 5.8) were used recently in the analysis of experimental data obtained in the experiment at NSCL with the spectrometer A1900 using the reaction 18O(120 AMeV)+Be(1166 mg/cm2). Experimental spectra were analyzed by the program BI, after some unnecessary peaks were eliminated in the LISE program, and the resulting files were transmitted to Excel and later after an analysis to Origin. 18 brho scanning files for different momentum distribution models and for different setting fragments were created by the LISE code and transmitted to Origin, too. You may see the result plots in Fig.16. Using the new utilities accelerates the analysis by a factor of ten! The complete analysis took less than two working days of one physicist!!!
Fig.16.
Brho
scanning plots for isotopes 6,8He, 8,9,11Li, 14Be
in the reaction 18O(120 AMeV)+Be(1166 mg/cm2)
(Click
the firgure to zoom).
4.2. Options files
All LISE in-built setting after clicking the button “Make it default” are saved in the file LISE.INI. However, from experience sometimes physicists work on one computer with the LISE code but with different settings. In the new version there is a possibility to create an option file of options, which is found in the directory OPTIONS. The user should use the menu “File” in order to save or to load private settings in/from the option file.
4.3. Print of the dialogs "Physical Calculator" and "Goodies"
Opportunity of printing the dialogs “Physical calculator” and “Goodies” directly from the program has now been realized. The button "Print" existed since these dialogues were created, but print of dialogs was not possible, which often caused questions and inconvenience to the LISE users. We are glad to inform, that this lack is now corrected.