|
|
| lise.nscl.msu.edu
http:"//lise.nscl.msu.edu |
East
Lansing
07-Mar-2002 |
Fusion residue transmission

|
Contents:
1. How to calculate fusion residue transmission (step by step)
1.1. Choosing Reaction type
1.2. Beam, Target, Residue settings
1.3. Options
2. Characteristics of fusion residue calculations
2.1. Kinematics distributions of fusion residues
3.1. Two-dimensional plots for cross sections, transmission and database characteristics
3.2. Modification of evaporation calculation procedure
3.3. LISE.xls — stopping power functions
References
1. How to calculate fusion residue transmission (step by step)
A new fusion-evaporation model "LisFus" for the fast calculations of fusion residue cross sections has been developed. This model is based on the Bass fusion cross-section algorithm [Bas74], the evaporation cascade code of Gaimard and Schmidt’s Abrasion-Ablation model [Gai91], and the transport integral theory [Baz94]. The user has also the possibility to use fusion residue cross sections calculated by the program PACE, which has been incorporated in the LISE package. The code PACE [Gav80] (Projection Angular-momentum Coupled Evaporation) is a modified version of JULIAN - the Hillman-Eyal evaporation code using a Monte-Carlo method coupling angular momentum. The program LISE has now the possibility to calculate the transmission of fusion residues through a fragment separator. The transmission calculations have to be performed following the steps described below:
1.1. Choosing Reaction type
Choose the "Fusion → Residue" option in the "Production mechanism" dialog (menu "Options"). There are no other settings for the "Fusion → Residue" reaction in this. At this point the SETUP window will show:
|
A message "Fusion → Residue" |
|
|
A new "C"ompound button |
|
|
A "R"esidual button instead of "S"etting Fragment |
|
|
The Compound cell in the table of nuclides is marked in green |
|
1.2. Beam, Target, Residue settings
|
Input of next values: |
Example |
|
|
Beam |
A, Z, Q |
40 Ar18+ |
|
Energy |
15 MeV/u |
|
|
Intensity |
1000 enA |
|
|
Target |
A, Z (! No composite target!!!) |
9 Be |
|
Thickness should be close to 0 |
50 micron |
|
|
Residue |
A, Z |
42 Ca |
The user can input an expected thickness target value if he or she is sure that this thickness will be satisfactory for this beam-target-residue combination, but it is recommended to calculate a thickness value by following the next steps.
1.3. Options
1.3.1. The "Preferences" dialog
For fusion residue reactions it is strongly recommended to SET the "Charge State" option ON! To decrease the calculation time (fusion calculations take more time than fragmentation) it is recommended to use the following values:
|
Calculation WITH charge states |
=< 64 |
|
Number points for 'Optimal target' plot |
~ 32 |
1.3.2. The "Prefragment search and Evaporation options" dialog
The "Prefragment search" part of this dialog will be blocked when the reaction "Fusion→residue" has been chosen. For fast calculations it is recommended to use
|
Only three basic mode of decay: |
proton, neutron, alpha |
|
Dimension of evaporation distribution: |
32 |
|
Modes Auto/Manual: |
auto |
|
1.4. Residue excitation function The next task is to determinate the excitation energy value of the compound nucleus corresponding to the maximum of the residue production cross section. To do this the user can load the subroutine to plot the excitation function one of two possible ways: from the "Fusion-residue information window" dialog (see Fig.1, item A), or from the "Plots → Cross section distributions" menu. If the reaction mode "Fusion → Residue" is selected, the "Cross sections" dialog (menu "Options"), and the "Cross section Plot" dialog (menu "Plots", see Fig.2) will correspond to the fusion-residue reaction. As an example the excitation function of the 42Ca residue from the 49Ti compound is shown in Fig.3 (it takes only 20 seconds on average to perform these calculations!!!).Note: It is possible to skip this step if the "Cross sections from file" option in the "Preferences" dialog is set, and set the input cross section value for the chosen residue independent from energy in the "Cross sections" dialog (menu "Options"). The program will automatically try to calculate "LisFus" fusion-residue cross sections and show them in the "Cross sections" dialog, but the user can break out of the calculation by clicking Cancel in the "Choose a range to calculate" dialog and input his or her own cross section value. |
Fig.1. The Fusion-Residue information window. It is activated by clicking the “C”ompound button in the SETUP window (see chapter 1.1.). |
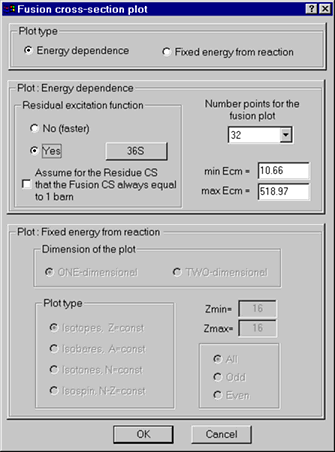 |
Fig.2. The "Fusion cross section plot" dialog. To obtain the excitation function of a residue the user has to choose the options "Energy dependence" and "Calculate a residue excitation function — YES". The recommended number of points for the fusion plot is 32. |
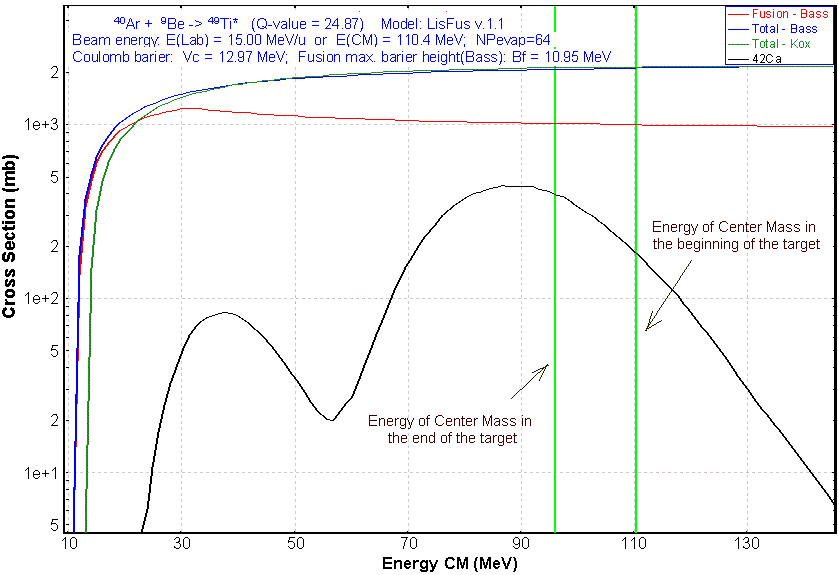
Fig.3. The excitation function of 42Ca residues from the 49Ti compound is shown (black curve). Fusion, Total (Bass), and Total (Kox) cross section distributions for the reaction 40Ar+ 9Be are shown respectively in red, blue and green colors. The vertical green lines indicate the energy in center of mass at the beginning and the end of the target respectively. The two-peak shape of the 42Ca excitation function can be explained by the domination of the a -channel from intermediate nucleus 46Ti at an energy of 40 MeV (in CM), whereas at an energy of 100 MeV the final residue is created by p- & n-channels (see "Evaporation calculator" for details).
1.5. Setting of residue ion charge In the case of fusion reactions attention should be paid to the ionic charge of the residue, as fusion reactions take place at lower energies than fragmentation. The present step is to estimate the ionic charge after the target based on the excitation function obtained during the previous step. For this purpose a Fusion-Residue calculator has been developed (see Fig.4). In our example the maximum cross section for 42Ca production from Fig.3 corresponds to 90 MeV (CM). The ion charge of the residue obtained at this energy is equal to 19.04 using the Fusion-Residue calculator. The initial beam energy in our example is higher and it is assumed that the energy lost in the target slows the beam down to the optimum energy of 12.23 MeV/u. To increase the yield of a residue the target thickness can be increased, which will lower the charge state even further. Thus it is better to round off the ionic charge to the smallest integer. The calculated ion charge of the residue (i.e. 42Ca19+ 19+) has to be entered in the Residue setting dialog ("R"esidual button in the "SETUP" window, see chapter 1.1.). |
Fig.4. The “Fusion-Residue calculator” dialog helps the user to get transformations from one of six fusion→residue reaction characteristics to the others. This dialog can be activated from the “Fusion information” window (see Fig.1, item B), or via the “Calculations” menu. |
1.6. Target thickness
The subroutine "Optimal target plot" (menu "Calculations") is used to get the maximum rate of the chosen residue. The target thickness calculations for the residue 42Ca19+ 19+ are shown in Fig.5. The user can click the ![]() button to put the calculated values into the program settings.
button to put the calculated values into the program settings.
This step is the most time consuming. A benchmark table (Table 1) for various configurations is given below. A Pentium III (600 MHz, 128MB RAM) computer has been used for the calculations.
Table 1.
|
Dimension of evaporation distributions |
N. points for optimal plot |
Dimension of transmission distributions |
Evaporation channels |
Setting |
Time, |
coef |
|
32 |
32 |
64 |
3 |
42 Ca19+ |
46 |
1 |
|
32 |
64 |
64 |
3 |
42 Ca19+ |
80 |
1.74 |
|
64 |
32 |
64 |
3 |
42 Ca19+ |
89 |
1.93 |
|
32 |
32 |
64 |
8 |
42 Ca19+ |
70 |
1.52 |
|
32 |
32 |
128 |
3 |
42 Ca19+ |
65 |
1.41 |
|
32 |
32 |
64 |
3 |
35 Ar17+ |
72 |
1.57 |
|
64 |
64 |
128 |
8 |
42 Ca19+ |
360 |
7.83 |
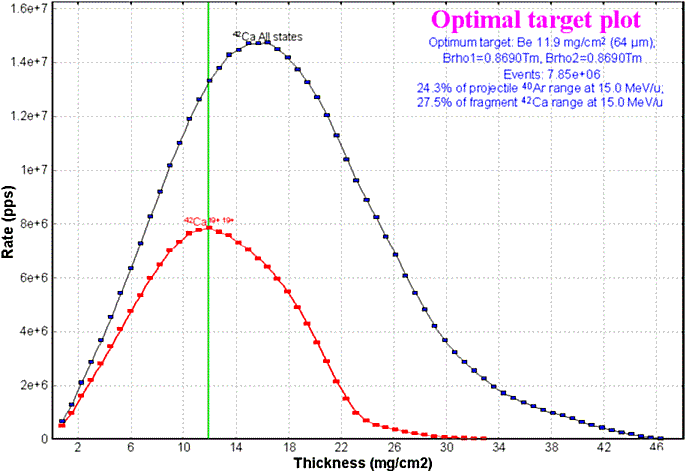
Fig.5. Yield of the 42Ca19+ 19+ ion (red line) as a function of target thickness in the reaction 40Ar(15 MeV/u)+Be ® 49Ti* ® 42Ca. The blue line corresponds to the sum of all charge states of 42Ca when the fragment separator is tuned on 42Ca19+ 19+.
1.7. Separation
The final step is the calculation of the selection of the chosen residual by the separation devices to maximize transmission and purity. In today’s version, four methods of separation are available in the program LISE: magnetic rigidity, energy loss in a wedge located in the dispersive focal plane, Wien velocity filter, and combination of a Wien filter and a dipole. The most popular method of separation for small energies is velocity separation (velocity filter). At small energies using energy loss in a wedge is ruled out. In the future electrostatic and gas-filled separators will be available in the program LISE. A comparison of different methods of selection is shown in Table 2 and Fig.6, where it is apparent that the "Velocity Filter + Dipole D6" (VAMOS) method gives the best results: best purification and highest intensity of the chosen residue.
Table 2.
Comparison of the performance of different kinds of low-energy residue selection.|
Selection |
Output of 42Ca19+ |
Sum output of all ions |
|
Dipole (dp/p=3%) |
4.1e+6 |
1.7e+7 |
|
Dipole & Wien |
2.0e+6 |
2.4e+6 |
|
Dipole & Wien+D6 |
4.1e+6 |
4.3e+6 |
|
Wien+D6 (VAMOS) |
2.4e+7 |
2.6e+7 |
|
|
|
|
|
|
Fig.6.
dE-E plots for different types of selection. The most intense peak on all pictures corresponds to the ion 42Ca19+.2. Characteristics of fusion residue calculations
The yield of reaction products (Isec) selected by a fragment separator depends from the primary beam intensity (Ibeam), the number of atoms in the target (N), the production cross section (CS), and the transmission (coef) through the fragment separator: Isec = Ibeam× CS× N× coef. Assuming Ibeam and N are constant the remaining parameters to calculate are the cross section of residue production and the transmission. In order to calculate the transmission it is necessary to know:
a) The kinematics distributions
1) Momentum distribution (average velocity and momentum distribution width for gaussian distributions)
2) Angular distributions (widths of parallel and perpendicular momentum distributions)
b) The charge state distribution of the residue (calculated as for fragmentation reactions)
This chapter is devoted to the principles of cross section and kinematics distribution calculations.
2.1. Kinematics distributions of fusion residues
2.1.1. Momentum distribution
The residue velocity after reaction (fusion and evaporation of light particles) is assumed to be equal to the compound nucleus recoil velocity. A Maxwell distribution of velocities is used to calculate the root-mean-square velocity after evaporation of light particles. To simplify calculations and to get the result in an analytical form it was assumed that:
In this case it is possible to consider the final distribution as the convolution of
(Acompound-Aresidue) gaussian distributions with ![]() .
Thus the width of the final gaussian distribution is equal to
.
Thus the width of the final gaussian distribution is equal to ![]() and the root-mean square velocity is determined as
and the root-mean square velocity is determined as ![]() (the parallel and perpendicular components of the momentum
distribution are
(the parallel and perpendicular components of the momentum
distribution are ![]() respectively).
respectively).
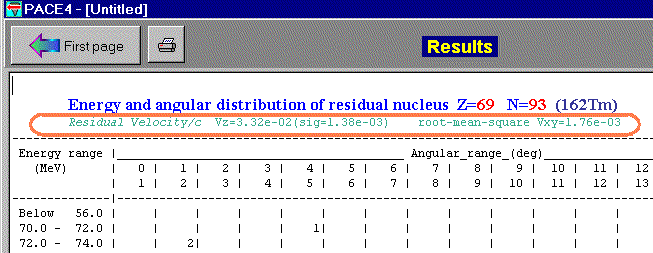
Fig.7. Fragment of the PACE4 result window. The results of the root-mean square velocity subroutine are shown in a red rounded rectangle.
The initial excitation energy of the compound nuclei is taken as the average of excitation energy between the beginning and the end of the target. A root-mean-square velocity calculation subroutine has been added to the PACE4 program for the "beam & target" mode to check this assumption (see Fig.7).
Comparisons between the LISE and PACE4 calculations were made for different combinations of "beam & target & excitation energy". The residue velocity calculations performed by the PACE4 program using a Monte Carlo method are close to the LISE simplified model (see examples in Fig.8). Some discrepancies are observed for high excitation energies of heavy compounds (see the right bottom plot in Fig.8) but for the fast calculations performed in the LISE program the agreement is acceptable. The results from the PACE program were used only for nuclei which output exceeded three hundred events.
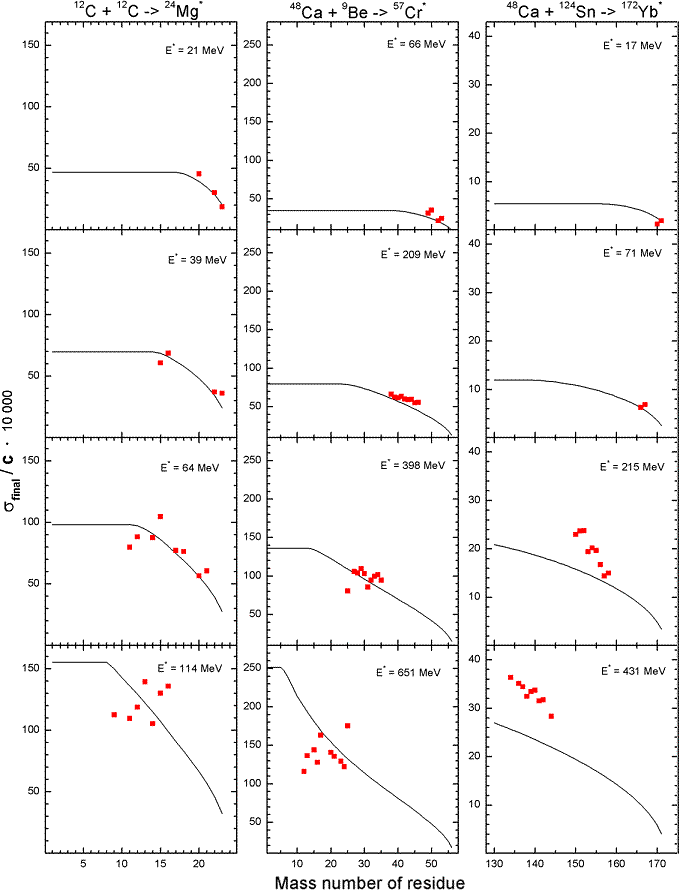
Fig.8. The widths of velocity distribution versus the mass number of residue calculated by the PACE4 code (red rectangle) and the LISE program (black curve) for three different reactions 12C+12C (left), 48Ca+9Be (middle), and 48Ca+124Sn (right) at several excitation energies.
2.1.2. Angular distributions
Angular distributions in the center of mass system are assumed isotropic. The calculated widths of longitudinal and transverse momentum distributions are used with the formula from the work [Bor83] to get the angular distributions of residues.
2.2. Fusion residue cross sections
The program assumes that the targets used are thin enough and that the cross section of residue formation is constant within the target thickness. Since the calculation of the cross section is the most time consuming, this assumption greatly shortens the overall calculation time. The program is performing the following steps to calculate the cross section of a fusion residue:

It is possible to see the evolution of the excitation functions using the Evaporation calculator in the mode "Excited nucleus evaporation".
In order to avoid long calculation times the program asks a minimum atomic number (Z) down to which to calculate the cross sections. The user can interrupt the calculations at any time by pressing the Escape key. In the case of the optimum thickness calculation the program automatically considers the cascade only down to the nucleus of interest. All values of calculated cross sections are kept in memory.
The number of kept cross sections is displayed in the "Setup" window ![]() .
These cross sections are not saved in the LIZ-file and are erased from memory if the following changes are made:
.
These cross sections are not saved in the LIZ-file and are erased from memory if the following changes are made:
2.2.1. Comparison between LISE and PACE4 fusion residue cross sections
The main advantage of the LISE code calculations ("LisFus") of residue formation cross section is the speed. The user can get the excitation function in a short time (typically less than one minute, if the residue is close to the compound nucleus, and the dimension of distributions is not to high). Only such type of fast calculations is suitable for the computation of the transmission and yield of fusion residues in a reasonable time.

Fig.9. Excitation functions of 36S, 36Ar, 42,43,46Ca, 44,46,46,47Ti fusion residues in the reaction 40Ar + 9Be are shown. The fusion barrier is equal to 10.95 MeV. The Q-value of the fusion reaction is equal to 24.87 MeV.
In order to test the validity of the approximations used in the LisFus model, comparisons with calculations from the PACE program were made for the reaction 40Ar + 9Be at various energies of the primary beam. The maximum angular momentum was taken from the optical model used in the PACE4 calculations. The calculations for the 49Ti excited compound nucleus were carried out at a maximum spin of 0.5 h. The excitation functions of some residues from the reaction 40Ar + 9Be are shown in Fig.9. Overall there is a quite good agreement between the calculations from the LisFus model and the PACE4 program except for the titanium isotopes. All excitation functions of the LisFus model for titanium isotopes have a systematic shift in the region of low excitation energies. This can be explained by the fact that at small excitation energies the program PACE predicts the deexcitation of nuclei by emission of gamma-rays, whereas in the LisFus model this decay channel is not included, as the only evaporation channels are emission of light particles.
2.3. Transmission of the primary beam
If the primary beam is among the transmitted in fusion residue mode, then the LISE program automatically switches to the fragmentation mode to calculate the transmission of the primary beam. It then returns in the fusion residue mode to get the transmission of this nucleus assuming it arose from the de-excitation of the compound nucleus.
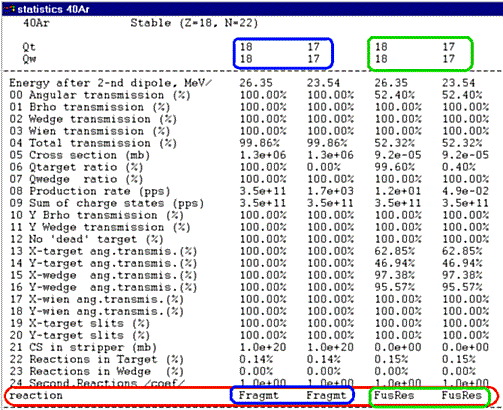
Fig.10. The transmission window of 40Ar nucleus.
The user can get the transmission window corresponding to the primary beam by clicking the right button of the mouse on the primary beam cell in the table of nuclides (see Fig.10). Both types of reactions can be seen, assuming that their transmission is not equal to zero. A label indicating what kind of reaction is responsible for the given charge states of the nucleus has been added after the transmission parameter number 24 (see the rounded rectangle in Fig.10). This option has been made especially to prevent from sending the primary beam into the detectors. The magnetic rigidity distributions of the transmitted charge states of 40Ar ion are shown in Fig.11.
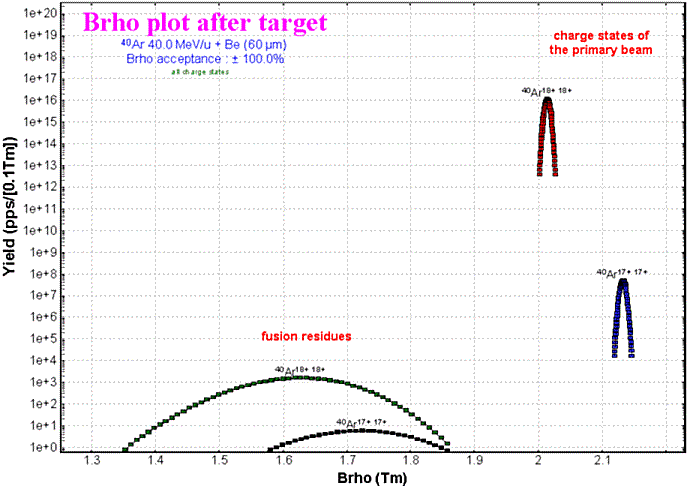
Fig.11. Magnetic rigidity distributions of charge states of the 40Ar nucleus after the target in the reaction 40Ar (40 MeV/u) + Be (60 microns). The charge states of the primary beam calculated in fragmentation mode dominate in this setting of the fragment separator.
It is also interesting to compare the outputs of fragmentation and fusion-evaporation reaction products and their energy distribution not only for the case of the primary beam, but for other nuclei as well. Performing this comparison requires the following conditions:
The energy of the primary beam should neither be too high, so that the cross section for fusion-evaporation is still significant, nor too low, so that projectile fragmentation can still occur
The overlap region between fragmentation and fusion-evaporation corresponds usually to a residue far enough from the compound nucleus, where the excitation energy of the compound is high
Both reactions coexist only for light targets where the compound is not too far from the primary beam
The nucleus of interest to be produced from projectile fragmentation must have less neutrons and protons than the primary beam

Fig.12.
Energy distributions of 32Al ions after the target in the reaction 40Ar (40 MeV/u) + Be (75 mg/cm2). The energy distribution for the fragmentation reaction is shown by the black curve, and for the fusion residue reaction by the red curve.As an example the reaction 40Ar (40MeV/u) + 9Be (75mg/cm2) -› 32Al has been chosen. The energy distributions of the 32Al ions after the target for both types of reactions are shown in Fig.12. For this case the products from both reactions can be well separated in the experiment. The velocity of the projectile fragment was assumed to be equal to the beam velocity and the Goldhaber momentum distributions was used to calculate the 32Al energy distribution for the fragmentation reaction.
3.1. Two-dimensional plots for cross sections, transmission and database characteristics
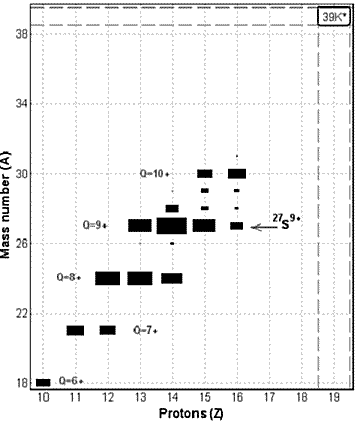
It is now possible to build two-dimensional plots of cross sections, transmission and database characteristics. Before plotting the data the user can choose in the dialogs what kind of plot he or she wishes. An example of a two-dimensional plot is shown in Fig.13.
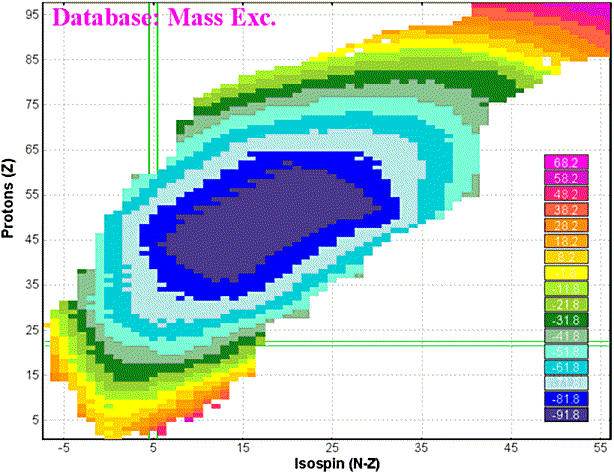
Fig.13. Mass excess values in a two-dimensional plot from the built-in database.
3.2. Modification of evaporation calculation procedure
A considerable change has taken place in the calculation of the daughter nuclei excitation functions of the evaporation cascade model. In the previous versions it was assumed that each i-th point of an intermediate nucleus excitation function had only one projection in the daughter nucleus excitation function:
, /1/
where S is the separation energy, B is the reduced coulomb barrier in the case of a charge particle evaporation, and t is the temperature of the daughter nucleus. The value in this i-th point of the daughter distribution was equal to the multiplication of the i-th value of the intermediate nucleus and the probability for this daughter evaporation channel:
. /2/
In the new version each i-th point of parent distribution is represented as a distribution following the Maxwell law with the an area normalization of /2/. Then all NPevap+1 partial daughter distributions are summed up to one final daughter distribution. The final result is shown in Fig.14. The initial excitation function was chosen as a very narrow rectangle (close to a delta function).
|
Fig.14. The initial excitation function of the 49Ti parent nucleus (left picture) is chosen close to a delta-function, and its daughters excitation functions calculated with the new method (right picture). |
3.3. LISE.xls - stopping power functions
Stopping power functions (dE/dx) have been incorporated in the lise_xls.dll library and can be loaded as a function in Excel through the LISE.xls file (see Fig.15).
Fig.15.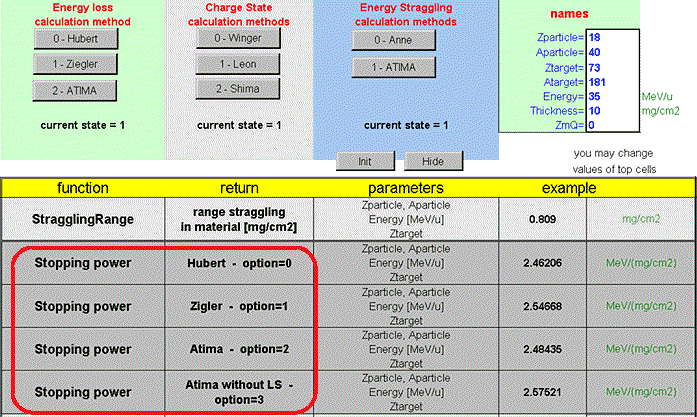
Acknowledgement
Fruitful discussions with A.Andreev, and M.Toennessen are gratefully acknowledged.
References:
[Bas74] R.Bass, Phys.Rev.Lett. 39 (1977) 265.
[Baz94] D.Bazin and B.Sherrill, Phys.Rev. E50 (1994) 4017-4021.
[Bor83] V.Borrel et al., Z.Phys.A 314 (1983) 191.
[Gai91] J.-J.Gaimard, K.-H.Schmidt, Nucl.Phys. A531 (1991) 709-745.
[Gav80] A.Gavron, Phys.Rev. C21 (1980) 230-236; (see ftp://ftp.nscl.msu.edu/lise/PACE_source).